In the previous task, you might have noticed that the word pairs in condition A were always two words whose meanings are related to each other, such as BUTTERFLY followed by BEE. On the other hand, the word pairs in condition B were always two words whose meanings are not related to each other, such as EDIT followed by BEE. This is the most important aspect of a priming experiment. A priming experiment is always about comparing how people process words that come after relatedi> words, vs. words that come after unrelated) words.
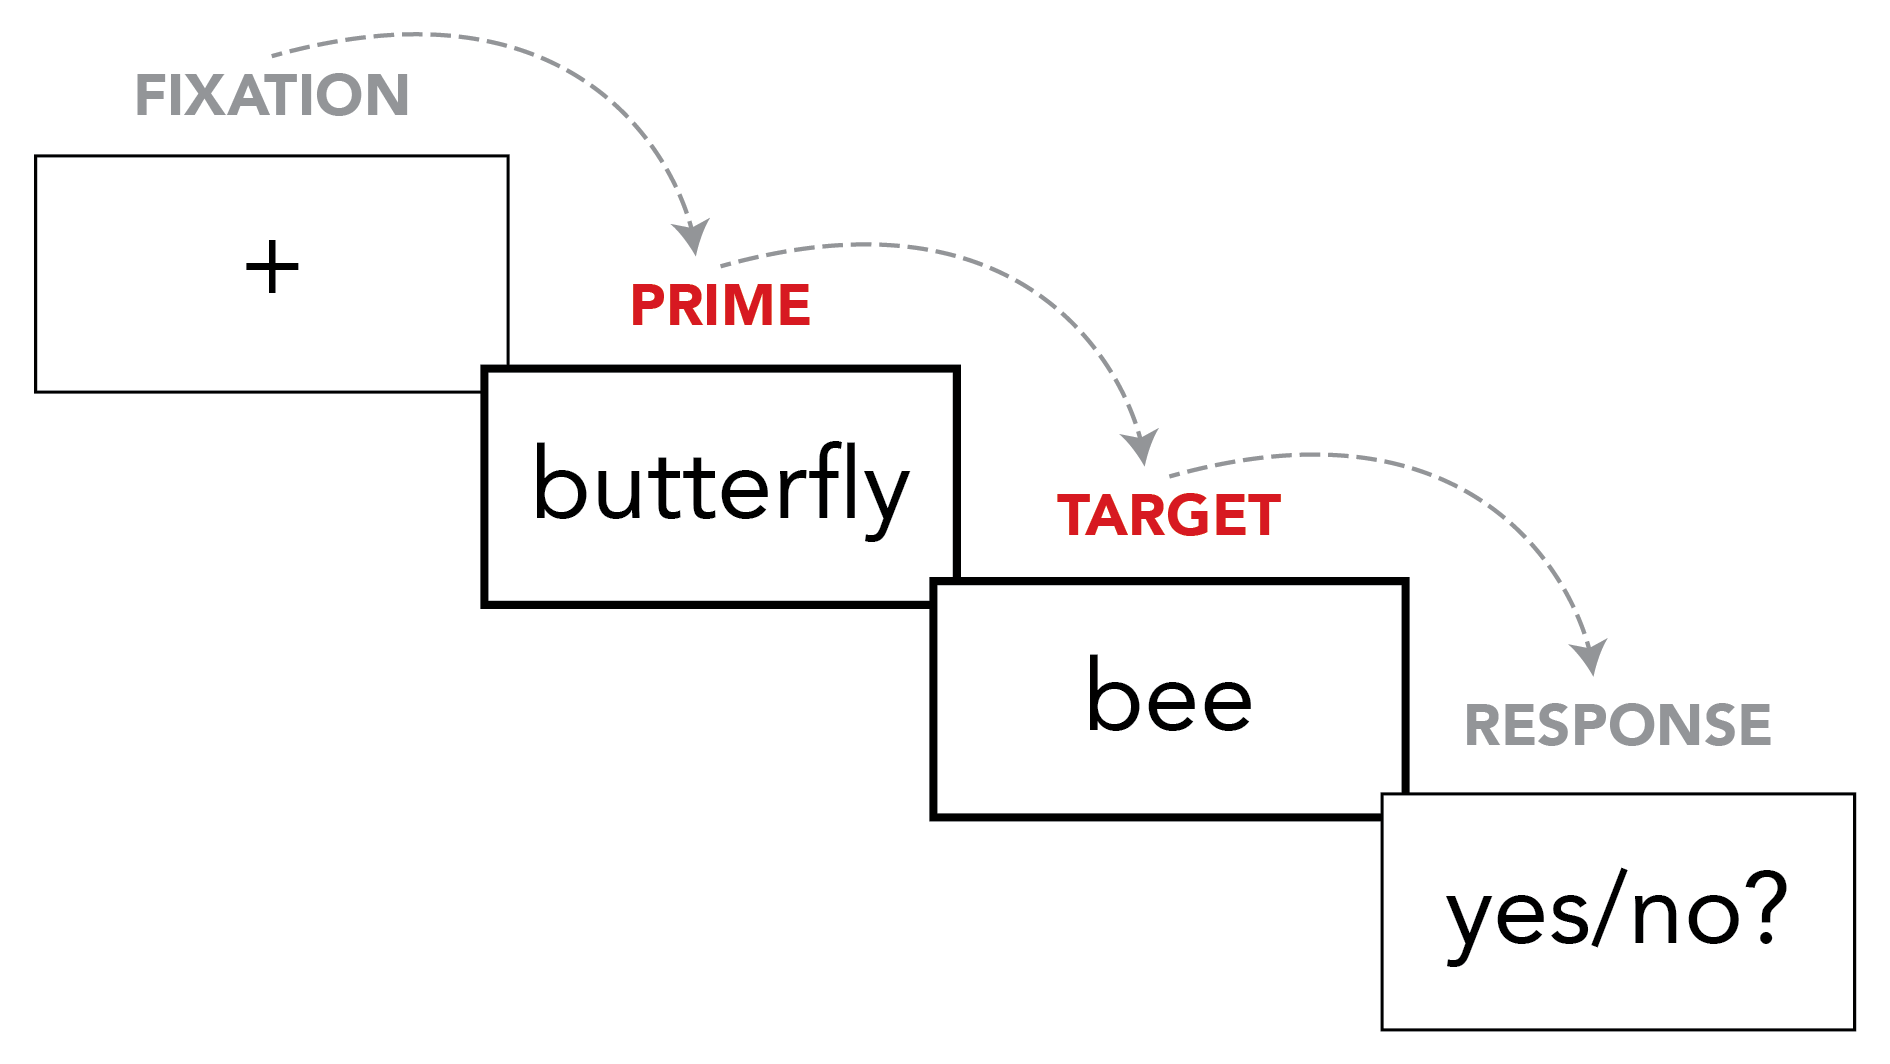
When we talk about priming experiments, we call the first word in the pair (e.g., BUTTERFLY or EDIT) the prime, and the second word (the word that the participant has to respond to by pressing a button) the target. So, for example, when someone in the experiment sees BUTTERFLY and then BEE, we would say they saw the target "BEE" with a related prime. When someone in the experiment sees EDIT and BEE, we would say they saw the target "BEE" with an unrelated prime.
In priming experiments we often want to know how quickly people respond to different kinds of targets (e.g., how quickly they respond to targets that came after related primes, and how quickly they respond to targets that came after unrelated primes). So, to do that, it's time for us to analyze your data.
Go to the place on your computer where you originally saved your .psyexp and the other files. You should see a new folder there ('data'), now that you have finished the experiment. In that folder, there will be a bunch of different files. The most important is an .csv file which has the participant ID you used when you did the experiment. Open this file. You should open it with a spreadsheet programme like Excel.
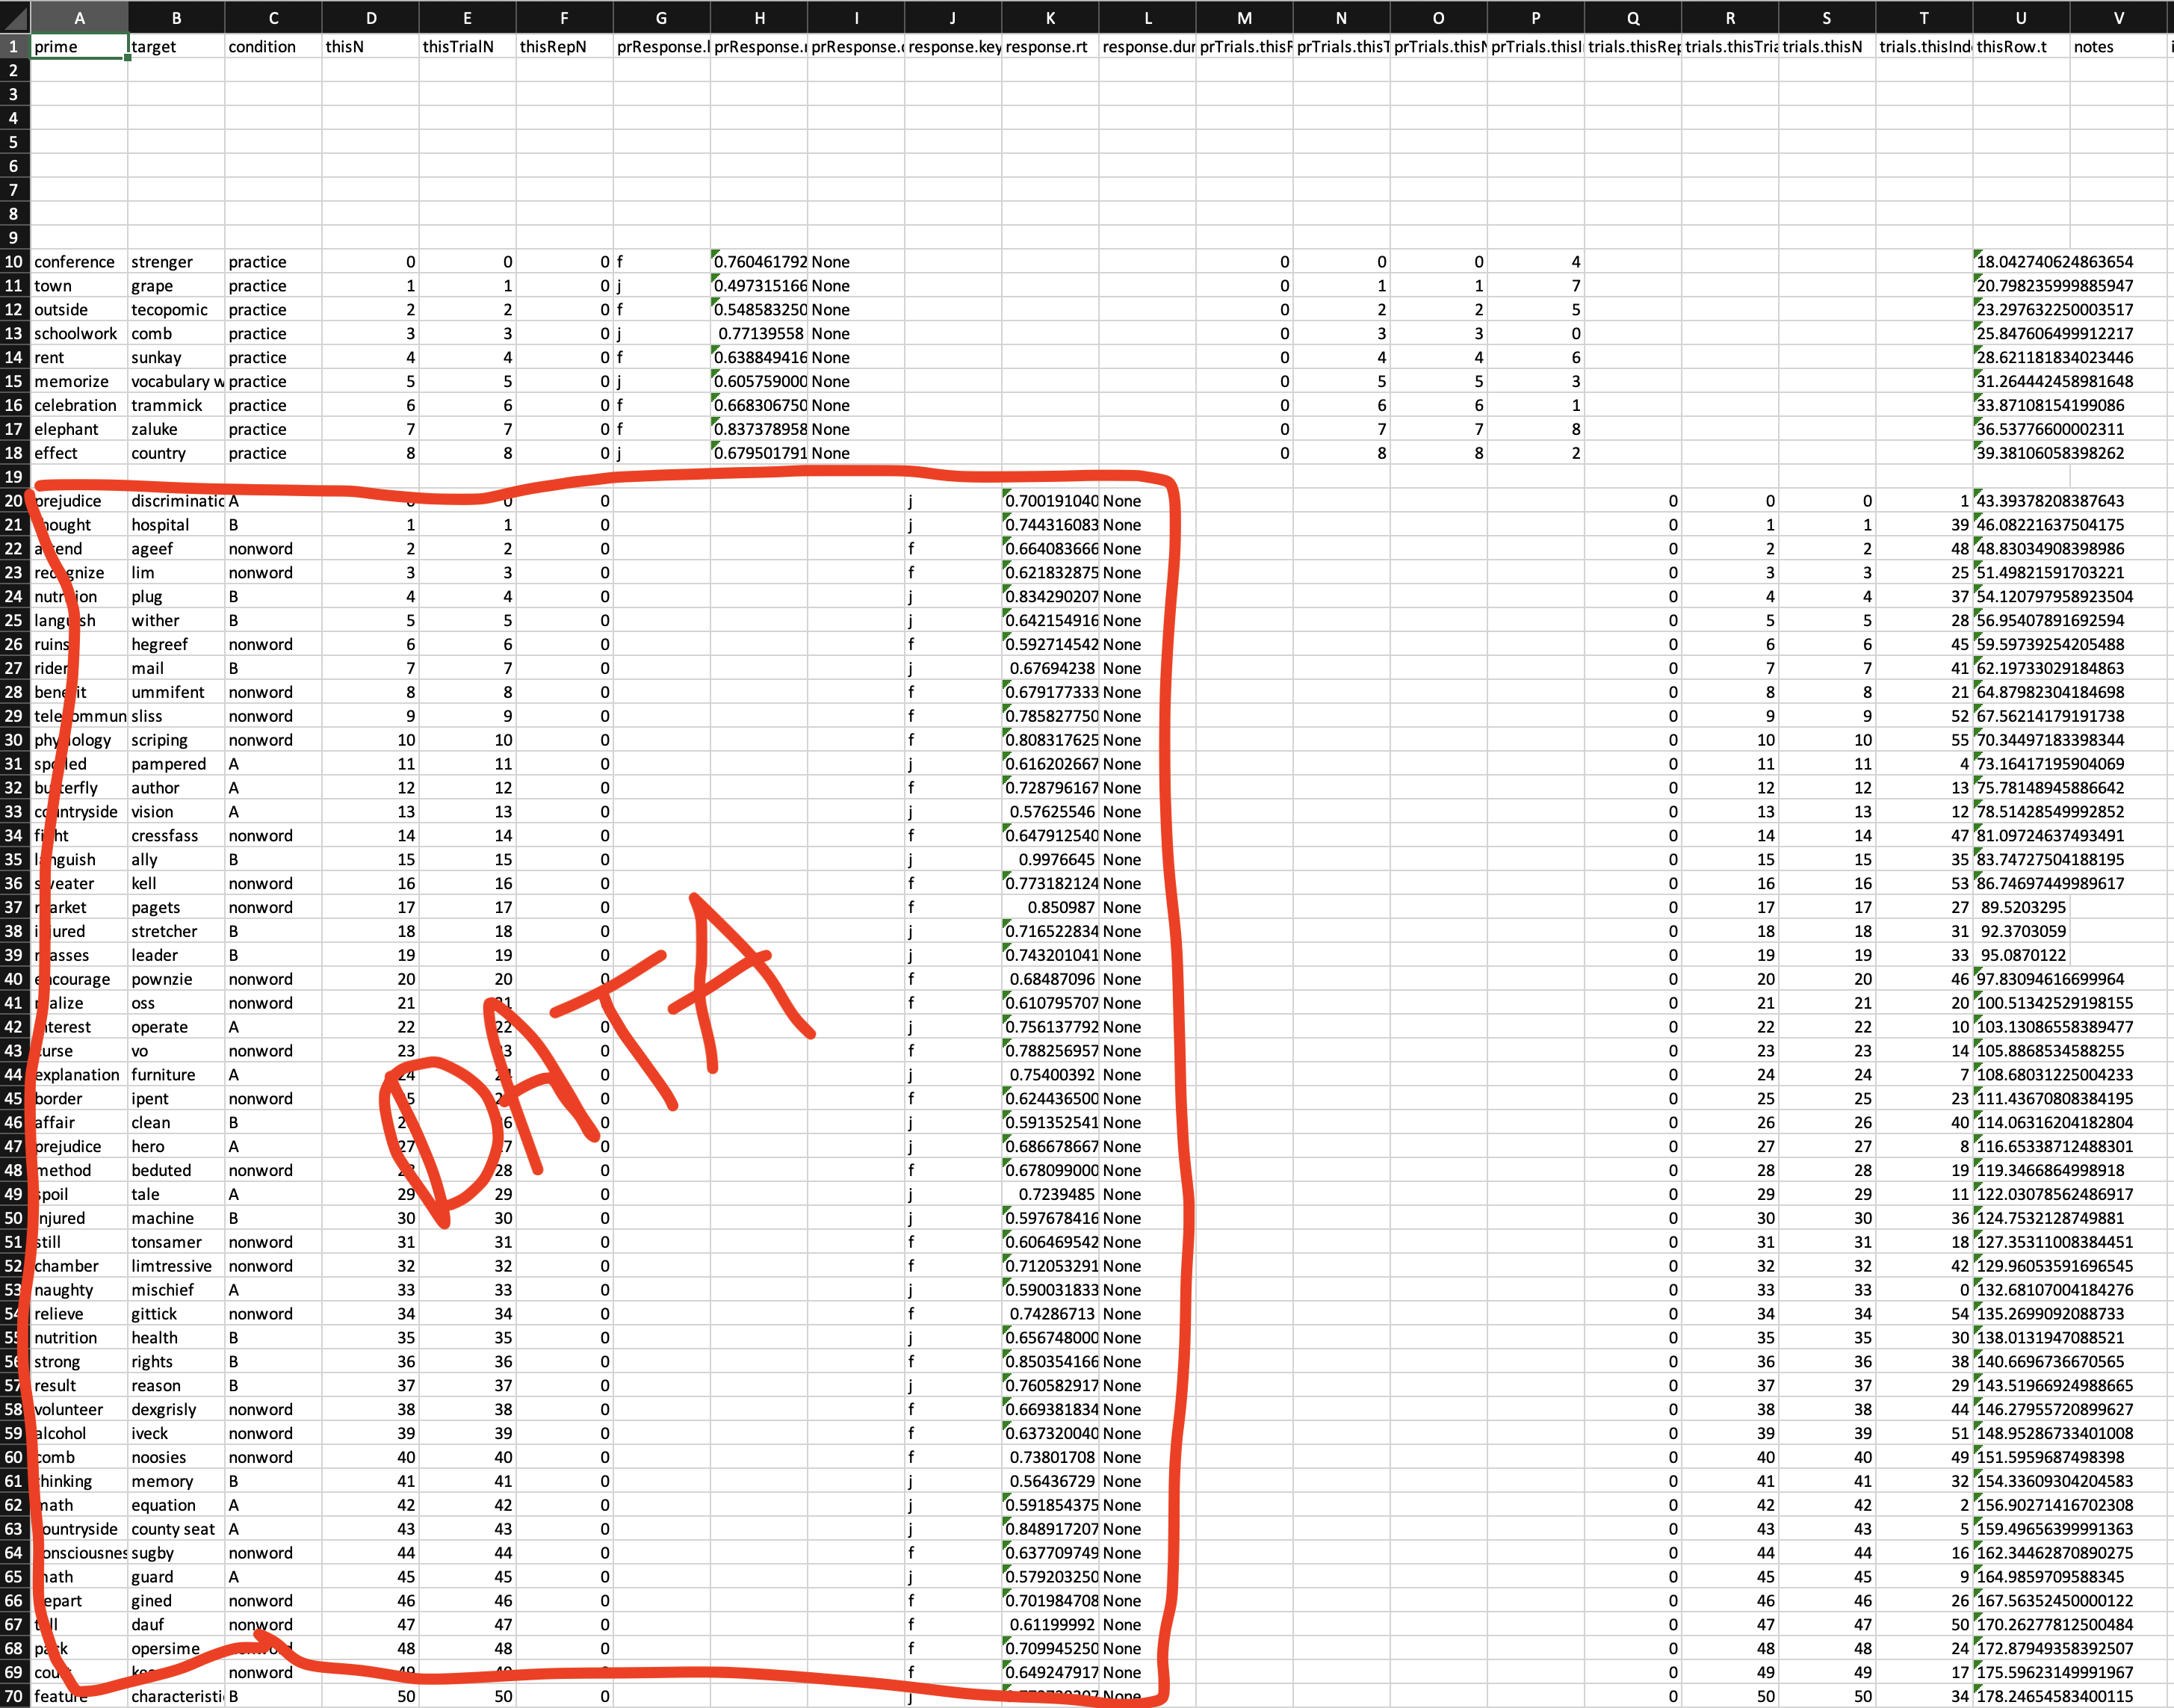
There will be a bunch of rows and columns of words and numbers, the important part starts about 20 rows down (you'll see about 9 rows that are the practice trials, and then below that is the experiment trials we are interested in). Here's a picture of what it looks like in Excel on my computer (some of the important rows circled in red).
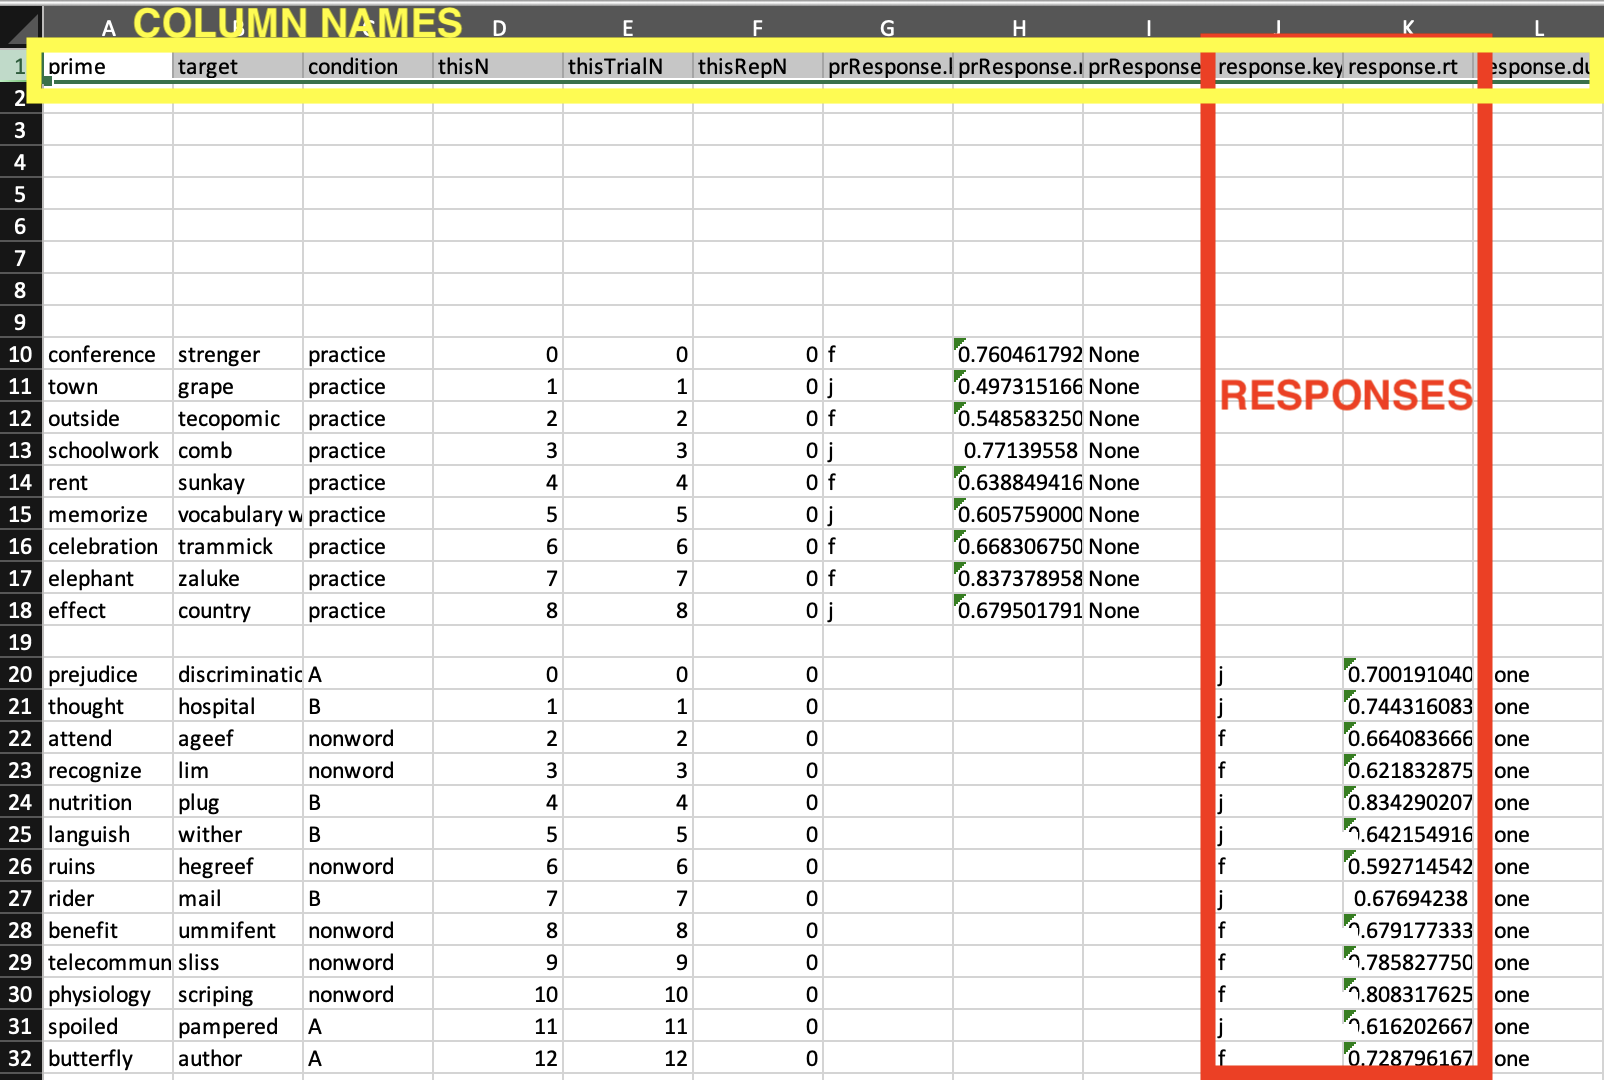
The real data that we are interested in is two columns of numbers, labeled 'response.key' and 'response.rt'. These columns show how you responded to the words. First, whether you pressed the 'J' (yes) or the 'F' (no) key, and then how quickly you pressed that key (time in milliseconds). Again, there's an image of what this looks like in my data.
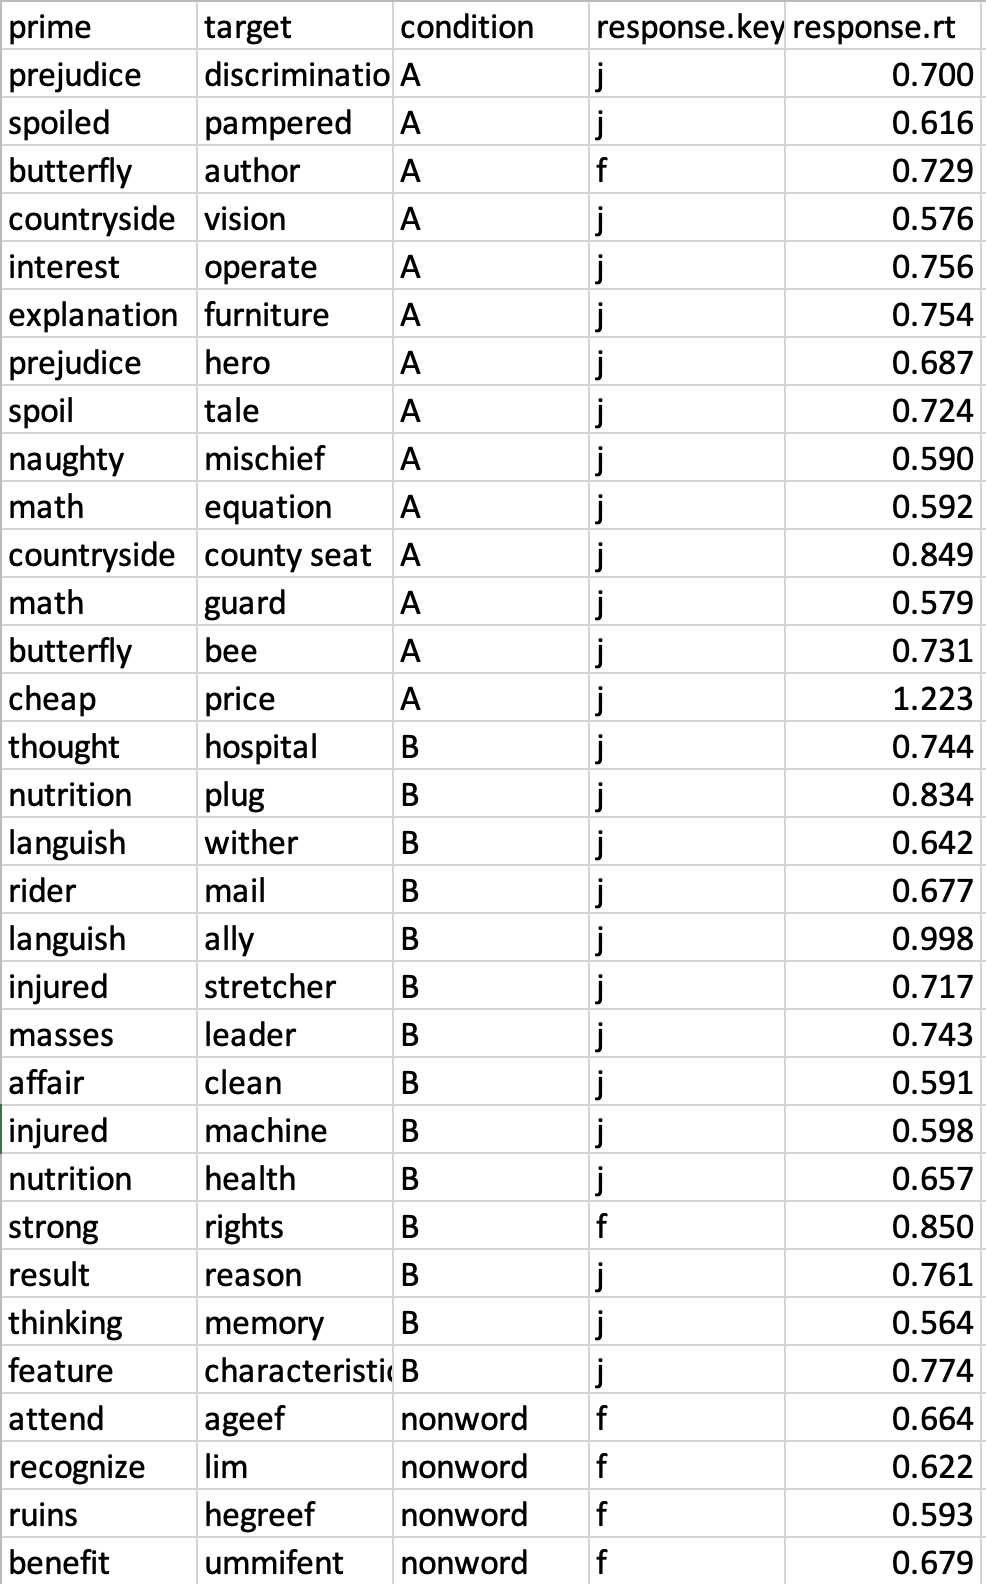
So, now you need to get those two response columns and pair them with the words and conditions we saw earlier. You can do that in lots of different ways (ask the internet or GenAI for help working with Excel if you aren't familiar with it). In the end, you want to have something that looks approximately like this next image. Notice, I organized all the condition A and B trials together, and I also rounded those very long numbers for response times into milliseconds (.001 = 1 ms).
Now you've got the data you're interested in all together, you can start to interpret it. Every line of data will have several important pieces of information. First, you'll see the prime and target words. For example, the first row you see in my data in the picture is the trial with the prime word 'prejudice' and the target word 'discrimination'. Next, you see the "condition label" (A or B), which matches the conditions you saw before. This condition label helps us easily sort our data so we can compare the different conditions.
The next thing you see in my data is the "response key" (J for 'yes', F for 'no'). You can easily see if the response was correct (J for a real word), or incorrect (F for a real word). Usually in a priming experiment, most of these responses will be correct. The task is supposed to be easy and not meant to trick people into making wrong responses. Finally, the most important part of the data is the "response time" (also called "reaction time"). This is such a common thing in psycholinguistic research that we just call it 'RT'. The RT that you see in each line is the amount of time it took (how many milliseconds—a millisecond [毫秒] is 1/1000 of a second) for you to respond to that word (for example, for 'discrimination' my response was 0.700--or 700 milliseconds). The higher this number is, the longer it took you to respond.
Once we have our data organized by condition and the RTs ready to go, there is one extra complication we need to deal with. As mentioned above, some trials may have the WRONG response. That is, for a real word, the response is 'f' (not a real word), or for a nonword the response is 'j' (a real word). We have to decide what to do with these incorrect responses. One option is to just delete them—maybe you feel like these "incorrect" responses are not a valid reflection of normal language comprehension (for example, maybe you made a mistake on that word because you weren't paying close attention) and thus should not be included in the final result. Another option is you can just ignore whether the response was correct or incorrect. Either option is ok, you should do whichever you think is the most appropriate.
Now we are finally ready to analyze the data! I want you to calculate the average amount of time it took you to respond to targets that had related primes, and the average amount of time it took you to respond to targets that had unrelated primes. (There are many ways to do this; you can do it by hand or using a calculator; or if you have good computer skills, you can do it in Excel or even by writing a script in a programming language. In the "Building a priming experiment" module we will learn some efficient ways to analyze these kinds of data, but for now it's ok to do a low-tech way.) Remember to convert the time into milliseconds (you can just report three digits if the average is below 1 second, or four digits if it's longer than 1 second, e.g., 805 or 1020).
Once you have calculated your average for related and unrelated primes, add those results to this shared Google spreadsheet. By comparing with everyone's results, this will be a useful way to see the general trend across multiple people (for example, if 90% of people were faster for 'related' than for 'unrelated' and 10% were faster for 'unrelated' than 'related'), which is important in any empirical research.
When you have finished, continue to the reflection questions below.
Look at all the results entered so far in our Google spreadsheet. Based on the results so far, which kinds of targets would you conclude are responded to faster? (There may be a lot of different results on the spreadsheet. To make a conclusion, you might want to look at the average for related [by averaging across all students' "related" reaction times], compared to the average for unrelated [by averaging across all students' "unrelated" reaction times]. Or, you might want to count how many people were faster for related, and how many people were faster for unrelated.)
Thinking back to your answer about the previous question (which kind of target is responded to faster), why do you think this happens? What happens in a person's mind to make this happen?
When you have finished these activities, continue to the next section of the module: "Interim summary about priming" (to be COMPLETED BEFORE NEXT CLASS).
modified by Eric Pelzl; original content by Stephen Politzer-Ahles. Last modified on 2026-Jan-13. CC-BY-4.0.